Abstract
Unemployment is a macroeconomic problem that disturbs people most directly and strictly. The younger generation is exposed more by unemployment compared to adults due to different aspects. This study designed to identify the major determinants of youth unemployment in Kellem Wollega Zone. The research has employed descriptive and explanatory research design in this study, a combination of qualitative and quantitative approaches were employed. The data was collected by designating questionnaires to an overall number 366 youth by means of multi stage sampling technique in five selected kebeles. Descriptive and logistic regression model were used to analyze the collected data. The result from the study indicated that approximately one third of the respondents were employed, whereas the remaining two third was unemployed. The result of binary logistic regression analysis indicated that Sex, work experience, educational level of youth, Access to credit and attitude to words own Job had significant effect on youth unemployment in Kellem Wollega Zone. However, the variables Age, Marital status of youth and educational level of house hold head was found to be statistically insignificant. It is recommended that, motivating young people to improve their educational attainment, empower women, and participate more in social, economic and political aspects; encourage youth to increase their credit service and accessibility, and improve youth attitudes towards self-employment by providing them entrepreneur training were suggested as recommendations.
|
Published in
|
Journal of Business and Economic Development (Volume 10, Issue 2)
|
|
DOI
|
10.11648/j.jbed.20251002.15
|
|
Page(s)
|
94-113 |
|
Creative Commons
|

This is an Open Access article, distributed under the terms of the Creative Commons Attribution 4.0 International License (http://creativecommons.org/licenses/by/4.0/), which permits unrestricted use, distribution and reproduction in any medium or format, provided the original work is properly cited.
|
|
Copyright
|
Copyright © The Author(s), 2025. Published by Science Publishing Group
|
Keywords
Youth, Unemployment, Employment, Demographic, Socio-Economic
1. Introduction
1.1. Background of the Study
Both industrialized and emerging nations face the macroeconomic challenge of unemployment, albeit the severity and impact may vary from one country to the next. Even if its influence varies by country, it is taken into account globally to decrease its impact on economic progress (1). Particularly if a pandemic outbreak had just struck the world, unemployment would have increased dramatically in low-, medium-, and high-income nations. The impact of the Covid-19 pandemic, for instance, caused the OECD unemployment rate to rise to 5.6% in March 2020 (up from 5.2% in February 2020). However, preliminary data for April indicates an extraordinary increase, with women and young people making up the majority of the increase
| [35] | OECD. (2020). Unemployment Rates Report News Release: March 2020. |
[35]
. This demonstrates that the primary issue facing a nation is unemployment, which requires immediate attention.
According to ILO the size of the labor force in Sub-Saharan Africa rose by 3.3% in 2023. This means that there will be 53 million more working-age individuals in the labor force in 2023 than there were in 2019, and that number is predicted to rise by an additional 14 million in 2024. Although slightly below the average of 68% between 2010 and 2019, the labor force participation rate stayed at roughly 67% in 2019, which is comparable to the pre-pandemic level.
Particularly in Sub-Saharan Africa, entrepreneurship gives young people a significant way to enter the workforce, a way to pay for their education and sustain their families, and the ability to save money that can lessen the effects of shocks to the economy and other sectors. In Sub-Saharan Africa, nearly all working youth (95.8%) work in the informal sector, with an estimated two-thirds (74%) working for themselves
.
The Ethiopian Labour Force Survey (LFS) study states that urban youth (those between the ages of 15 and 29) experience unemployment at a higher rate than rural youth. Urban youth unemployment was 22.9% nationwide, compared with only 3.1% in rural areas (LFS, Citation 2013 cited at Essay, Citation 2020). Unemployment disproportionately impacts rural females were at 11.6% compared to 5.1% for rural males
| [12] | Central Statistical Agent. (2010). Report on Labor Force Survey 1999. Addis Ababa, Ethiopia: Statistical Bulletin. |
[12]
. This shows that the unemployment number was highly increasing in rural areas of Ethiopian regions.
Youth employment poses a significant issue for Ethiopia. The country is facing increasing levels of landlessness from rural areas as well as no job creation opportunity in agricultural areas. More young people may migrate from rural to urban areas in pursuit of employment as a result of this. Many Ethiopian adolescents may be forced to go to cities in search of work due to the lack of potential in the rural, which exacerbates the problems of underemployment and unemployment in urban areas.
Facilitating youth land access and rural job is important to stem this potential flow in migration and prevent falling economic development in both rural and urban regions of Ethiopia
| [7] | Abshoko, A. D. (2016). Determinants of youth unemployment evidence from Ethiopia. Global Journal of Human-Social Science: Arts & Humanities - Psychology, 16(4), Version 1.0 Year 2016. |
[7]
.
Ethiopia plans to implement ADLI measures to attain lower-middle-income status by 2025. With a per capita income of USD 790, the country is among the poorest, still (World Bank, 2018). In contrast to the Oromia region average of 5.4%, the country has recently been attaining a promising broad-based growth, averaging 9.9% year from 2007–08 to 2017–18 (WB, 2018). Despite these advancements, a major socioeconomic challenge in the country is the high rate of idleness. In 2009, the overall unemployment level was 19.1%; it was higher for women (26.4%) than for men (12.2%); the overall young unemployment rate in urban regions is 25.3%, with women experiencing a greater rate (30.9%) than males (18.6%).
Though unemployment is increasing, particularly in metropolitan areas, and it is more prevalent among young people, Ethiopia's economy is nevertheless growing. Many young Ethiopians are relocating to Europe and the Middle East in pursuit of work (Kemal, 2020). According to a report by the Central Measurable Organization (2018), the Benishangul Gumuz region contributes 10.7 the lowest unemployment rates, while the Oromia regional state of Ethiopia accounts for the largest share of the nation's urban areas with its 18.
The population of Oromia Regional State is more than 105 million. According to the Central Statistics Agency, youth make up 30% of the region's overall population and 34% of the country's population (46). However, based on the region's young employment situation, the youth unemployment rate was estimated to be around 21.2 % in 2005, with 14.1% of males and 26.5% of females (CSA, 2006). Both the region's rural and urban youth unemployment rates are included in this assessment. Additionally, in 2007 the region's urban districts had an 18.0 % youth unemployment rate, with 15.5 % of the males and a corresponding female jobless rate of 20.4 percent (12).
The persistent character of unemployment over the last decade in the world has become a great concern for academicians and policy makers. Unemployment is often used as a measure of the health of the economy because underutilization of human capital or unemployment is very important issue that negatively affects the development of the one’s country (32).
Many policymakers are aware of the advantages of funding young people. Although the issue is still widespread, governments are focusing on laws and educational initiatives to increase young people's access to the workforce. So far, (7) reported that Age, gender, access to market competence, family economic standing, youth educational attainment, and availability of electric power were all found to be important factors underlying youth unemployment. Determining the different potential causes linked to young unemployment in Kellem Wollega Zone was the objective of this study.
1.2. Statement of the Problem
Young people are particularly important to all countries in the world. It is possible to view youth as an engine for accomplishing development objectives. Young people are more creative, talented, energetic, open-minded, productive, and dynamic. They also shape the workforce of tomorrow's consumers, manufacturers, entrepreneurs, and workers. All of these young people's potentials are valuable assets for economies. Young people with creativity and energy would make the world a better place. It is therefore impossible to exclude young people from economies, society, and job markets. To meet development objectives, youth must be incorporated into the workforce and economies. An economy's social and economic outcomes are influenced by young people's capacity to participate in productive activities (20).
The rise in both urban and rural unemployment is significantly influenced by population increase. Even if there is a growing percentage of young people in the labor force, employment growth is insufficient to accommodate new workers. Most individuals below 30 who wish to work are unable to obtain employment. Social and economic issues such an increase in crimes, suicides, prostitution, alcoholism, market inflation, and poverty are brought on by the growth in youth unemployment (17).
High rates of youth unemployment are among Ethiopia's most serious socioeconomic issues. It causes social and economic issues that impede a nation's progress (17).
It causes societal unrest, a rise in crime, drug usage, and mental illnesses like depression, suicidal thoughts, and a sense of helplessness. It also results in a loss of resources, or human capital. Currently, massive youth unemployment has become the basis for disturbances and violent demonstrations by the youth in Ethiopia; the incident resulted in many deaths and damage to property worth of millions birr (5).
However, unemployment is a macroeconomic issue that has a significant and direct impact on people. Underemployment and unemployment are a result of the inability to utilize labor, a crucial component of production, to promote economic expansion. Youth in developing nations struggle to find safe and appropriate work in addition to finding employment opportunities.
Finding the factors that contribute to youth unemployment should be the first step in developing other solutions. Although there have been few studies on the factors that contribute to urban adolescent unemployment (6), the findings of these studies differ based on the particular socioeconomic circumstances of the research region.
The capital city, regional cities, and zonal towns were the subjects of the majority of the previous research, which was carried out in urban surroundings. Despite this, it ignored the rural and urban areas, as well as the administrative towns of Woreda. As a result, this study attempted to look at young unemployment in the Kellem Wollega Zone.
In addition, the determinants of youth unemployment have not yet studied and addressed in western Oromia especially in the Kellem Wollega Zone. By addressing the following fundamental research questions, the researcher aimed to fill up the gaps, including demographic and socioeconomic aspects influencing teenage unemployment in the study area.
1.3. Basic Research Questions
1) What were the demographic determinants of youth unemployment in Kellem Wollega Zone?
2) What were the socio-economic determinants of youth unemployment in the study area?
3) What possible solutions help to decrease the problem of unemployment among youths?
1.4. Objective of the Study
1.4.1. General Objective
The main objective of the present study was to identify the determinants of youth unemployment in the Kellem Wollega Zone.
1.4.2. Specific Objective
1) To assess the demographic factors affecting youth unemployment in the study area.
2) To examine socio-economic factors affecting youth unemployment in the study area.
3) To recommend the possible solutions that help to reduce the problem of youth unemployment.
1.5. Significance of the Study
The importance of the research would be to analyze something and to detect the main determining factors of young generation unemployment in Kellem Wollega Zone and above all this study mainly develops the thinking and analysis capacity of the researcher. The study was significant for the government, society, students and other research workers.
Decreasing the unemployment number was the core goal of the Ethiopian government as unemployment was a bottleneck for economic growth in the least developing countries. Moreover, the issue was getting more concern in the Oromia region, Kellem Wollega Zone. Therefore, all possible information results that would be generated from the study would be useful for any concerned authorities to take corrective actions in Kellem Wollega and other similar Zones. The research would give baseline information for policymakers and basic information about the problem that could Kellem Wollega Zone administrative to reduce the highest rate of youth unemployment. The research would also help as a potential reference used for any researcher interested in conducting further study on the problem and other related issues in the Kellem Wollega Zone.
1.6. Scope of the Study
A particular emphasis of this study would be determinants of youth unemployment whose age was 15-29 years found in Kellem Wollega Zone specifically in four selected representative Woreda and one Town was used as a point of reference from the zone. The study was conceptually limited to the main influencing elements such as the demographic and socio-economic factors that determines of youth unemployment.
1.7. Definition of Key Terms
In this section, it might be useful to consider and explain important concepts and terms related to the subject matter of the problem. Thus, it is very important to give some conceptual definition of the terms used in the study and attempts to explain them with the view to convey an explicit meaning for the readers.
Youth - A person between the ages of 15 and 29 is considered a youth, according to Ethiopia's Ministry of Youth, Sports, and Culture (MOYSC, 2004). Therefore, people between the ages of 15 and 29 were included in the youth category of this thesis.
Youth Unemployment- represents a number of unemployed young people aged 15 to 29 as a percentage of the total labor force where the total labor force that includes both the unemployed and the employed.
Economically active youths- are persons aged 15 to 29 years – for this research.
Unemployment - defined as all individuals between a specified age who during the reference period were "without work", but are "currently available for work" and are "seeking work", i.e. had taken specific steps in a specified reference period to seek paid employment or self-employment (CSA, 2018).
Demographic factors- refer to the statistical characteristics of population such as age, gender and marital status. These factors influence individuals’ attitudes and decision regarding various interventions and behaviors.
Socioeconomic factors- are economic indicators that are used to model the characteristics of communities, social groups and households. For example, in this study socioeconomic factors included and used to categorize population are work experience of youth, education level of youth, credit accessibility, attitude towards own jobs and education level of house hold head of youth.
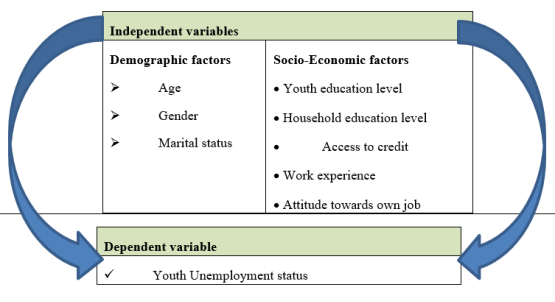
1.8. Conceptual Framework
Demographic and socioeconomic influences, such as age, sex, marital status, youth education status, house hold education status, work experience, credit availability, and attitude toward one's own job, are used as explanatory variables in this study to examine the factors that contribute to youth unemployment, while youth status is used as the dependent variable. Designing the proper conceptual framework for the study in order to solve this complex issue would result from such a methodical examination into identifying the primary elements that affect young unemployment.
Figure 1. Conceptual Framework.
2. Research Methodology
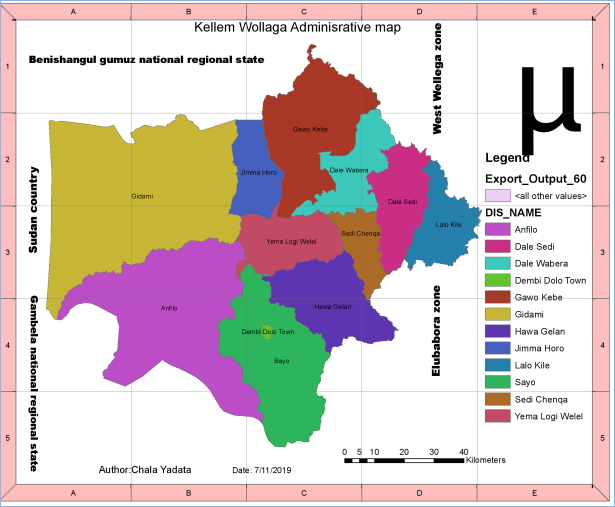
2.1. Description of the Study Area
Kellem Wollega Zone is one Zone of the Oromia regional state which is located in South-Western part of Ethiopia. The Zone has eleven Woreda and one capital town which is found at a distance of 627 km from the capital city of Ethiopia, Addis Ababa. This Zone is found in West Oromia Regional State being surrounded by Gambela Region in the South, Benishangul Gumuz in the West, Western Wollega Zone in the North-East, and Buno Bedelle in the South-East and is located between latitude of 8o2’N, 34o20’E, and longitude of 9.20oN and 35.20o E. Kellem Wellega Zone has an elevation of between 1,701 m (5,581 ft.) and 1,827 m (5,994 ft.) above sea level.
According to (Kidane 2022), the Zone has huge natural resource potential, familiar for commercial crops such as coffee and attractive tourism resources. As per the information from the same source; 10,054 Small and Micro enterprises are actively participating in business engaged in different sub-sectors.
According to Kellem Wollega Zone Health Office (2024), the Zone has a total population of 1,204,269 populations and from these 610,565 is male and 593,704 are females. The total number of young population (ages 15-29) in the Zone is 275,000 of which 143,016 are male and 131,984 are female (Kellem Wollega Zone Youth and Sports Office (2024). Approximately 89.4% of the zone's total population generally lives in rural areas, with the remaining 10.6% residing in urban areas.
Figure 2. The Study Area.
2.2. Research Design
A cross-sectional study was used by the researcher, meaning that any relevant information would be gathered at one particular moment. Due to time constraints and the study's extensive scope, a cross-sectional study was preferred (25). Another reason for using a cross-sectional study design was fairly fast, low-cost, and simple to Perform, and results were simple to analyze (Reaves, 1992; Kirkwood, 1988). Also, a cross-sectional study was mainly suitable for studying that are quantitatively measurable conditions.
The research used both descriptive and explanatory research design to assess the key determinant that influences youth unemployment in Kellem Wollega Zone. The research combined qualitative and quantitative methods, referred to as a mixed approach, which best addressed the main research questions. The explanatory sequential mixed method is a kind of approach where the researcher starts with quantitative analyses and then examines qualitative data.
2.3. Target Population
The concentration of this research was a youth population aged between 15 and 29 who were economically active found in Kellem Wollega Zone specifically from four Woreda called Sayo, Hawa Galan, Gidami and Dale Sadi Woreda were selected purposively due to their high youth population. Dambi Dollo town was selected due to its high youth migration from surrounding rural areas to the town (Mohammed, 2018). One kebele would be selected from each Woreda; accordingly, Chamo (from Dale Sadi), Abba Jarra (from Sayo), Mojo (from Hawa Galan), Mole (from Gidami), Yabalo (from Dambi Dollo town) kebeles were used. In these kebeles there were 4305 youth of 15-29 ages and who were economically active. Finally from the youth population of each kebele, the sample size was taken as per proportional allocation rules (25). The unemployed and employed youth were attended as units of respondents to whom the study questionnaire was administered.
2.4. Sampling Techniques
The collection of important data from the whole population has great power to generate a sound full and more precise finding. However, the approach was more head-striking in terms of finance and duration of time. Hence, the representative samples were drawn from the whole population. In light of this, Leary (2004) stated that the researcher ought to carefully choose samples that best support his findings.
Generally, the research employed multistage sampling techniques. While choosing a sample from a relatively vast area, the multistage sampling technique was typically employed. Multi-stage sampling, as the name implies, is a sample method that was used in multiple phases, as the following table illustrates.
Table 1. Sampling technique used.
Stage of sampling technique | Sample selected | Sampling Technique used | Reason |
Stage I | Kellem Wollega Zone | Purposively | Due to their research gap |
Stage II | Four woredas and one administrative town | Purposively | Due to their high youth population |
Stage III | One Kebele from each woreda and One Kebele from the town | Simple random sampling | It reduces bias and gives every member of the population an equal chance to participate in a study |
Stage IV | Respondents | Cluster sampling | It reduces bias and provides each individual in the Population a fair opportunity to take part in a study. |
Source: Self-developed (2024).
2.5. Determining the Sample Size
To get a representative sample size, the study used Yamane's (1967) formula for determining sample sizes.
n===366
Where:
n is the represents sample size,
N is the total young people of selected kebeles which is totally 4305 (from respective kebeles woreda youth and sports Office 2024) and
e is the level of precision defined to determine the required sample size at a 95% confidence level.
According to the proportional allocation rules the population size of each kebele sample size was taken from each stratum.
Table 2. General Youth in Kellem Wollega Zone.
L. No | Name of Woreda | Total number of Youth |
Male | Female | Total |
1 | Anfilo | 12,805 | 11,820 | 24,625 |
2 | Dale Sadi | 15,386 | 14,184 | 29,570 |
3 | Dale Wabera | 12,292 | 11,348 | 23,640 |
4 | Gawo Kebe | 14,853 | 13,712 | 28,565 |
5 | Gidami | 15,366 | 14,164 | 29,530 |
6 | Hawa Gelan | 16,390 | 15,130 | 31,520 |
7 | Jima Horo | 10,756 | 9,929 | 20,685 |
8 | Lalo Kile | 11,268 | 10,402 | 21,670 |
9 | Sadi Chenka | 8,195 | 7,565 | 15,760 |
10 | Sayo | 14,341 | 13,239 | 27,580 |
11 | Yemalogi Welel | 8,707 | 8038 | 16,745 |
12 | Dambi Dollo | 2657 | 2453 | 5110 |
| Total | 143,016 | 131,984 | 275,000 |
Source: Kellem Wollega Zone Youth and Sport Office (2024)
Table 3. Determining Sample size for each kebele.
S. No | Name of Woreda | Total numbers of Youth in the Woreda | Name Selected Kebele | Number of Youth in the Kebele (N) |
1 | Hawa Gelan | 31,520 | Mojo | 882 |
2 | Dale Sadi | 29,570 | Chamo | 741 |
3 | Gidami | 29,530 | Mole | 494 |
4 | Sayo | 27,580 | Abba Jarra | 929 |
5 | Dambi Dollo | 5110 | Yabalo | 1259 |
| Total | 123,310 | | 4305 |
Source: Kellem Wollega Zone and selected Woreda Youth and Sport Office (2024).
Table 4. Determining sample proportion of for selected Kebeles.
S. No | Name of Woreda | Name of Kebeles randomly selected | youth (N) population | Proportion n= (Ni * n /N) | Sample size from each kebele (n) |
1 | Hawa Gelan | Mojo | 882 | 882*366/4305 | 75 |
2 | Dale Sadi | Chamo | 741 | 741*366/4305 | 63 |
3 | Gidami | Mole | 494 | 494*366/4305 | 42 |
4 | Sayo | Abba Jarra | 929 | 929*366/4305 | 79 |
5 | Dambi Dollo | Yabalo | 1259 | 1259*366/4305 | 107 |
Total | 4305 | 366 | 366 |
Source: From own computation (2024)
2.6. Source of Data, Data Collection Methods and Procedures
Identification of proper and effective data collection tools is substantially important to make precise and effective research. The research was conducted at the personal level, from the sampling frame, or the entire population, from which the necessary number of samples were taken. This was the total number of young people in active labor who were located in five specified kebeles within the Kellem Wollega Zone. Hence, both primary and secondary data were used to attain the stated objectives.
Semi-structured interviews and questionnaires were used to collect cross-sectional primary data from a subset of respondents in the study area. Secondary data that was used as background information and was gathered from each Woreda Labour and Social Affairs Office, Woreda Youth and Sport Office and Kebele Administration head on the base of number, percentage, gender and educational status of unemployment. Finally, secondary data and information from various published and internet sources were employed.
In one day a maximum of 5 respondents were conducted once with each respondent, over an average of 30 minutes. The important data collected includes; gender, age and youth education status, work experience, marital status, access to credit, education status of the family head, attitude towards own job, possible consequence of becoming unemployed, possible solutions and opportunity to be employed, possible reason of none self-employment and the way forward to manage.
2.7. Method of Data Analysis
All primary data that was collected from respondents was organized based on variable characters like dependent, independent and finally analysed by discrete regression. Discrete regression models are models in which the dependent variable assumes discrete values. (27).
A model that best describes the behavior of a discrete dependent variable has been created by econometricians. Three methods are most frequently employed in econometric literatures for the simple discrete dependent variable. The linear probability model, the probit model and the logit model are examples of these models. The linear probability model has a clear drawback in that the expected probability values can lie outside the usual 0 o 1 range, and it also the accepted marginal or incremental effect of explanatory variables remains constant. As a result, this model was removed from the list of potential models (17).
The most common functional forms for models with binary dependent variables were the Logit and Probit models. Probit and logit model outcomes were often comparable. Despite having comparable results, mathematical convenience led to the decision between the two and the logit model is simpler to estimate. It was also appropriate to identify the influences that contribute to youth unemployment in the study area and to reflect the likelihood of growth. Because of this, it was believed that a binary logit model would be suitable for this investigation. The variable of response was binary. Yi, the response variable, took on the value 1 if the ith individual was unemployed and the value 0 otherwise. Unemployment, a latent variable, was the primary variable of interest, where the person
Yi= 1, if the ith person was unemployed
Yi=0, if the ith person was employed
To help with the comprehension of the coefficients, Gujarati (2004) expressed the logistic model in terms of the odds ratio and log of the odds ratio. The odds ratio in this study was the ratio of the likelihood that the individual was unemployed to the likelihood that they were employed.
Since (𝑧𝑖) = (𝑎 + 𝐵𝑖𝑥𝑖) it can be rewritten as easily understanding
Where: Pi is the likelihood that the respondent is unemployed, and (1-Pi) represents the likelihood that the respondent is employed.
e - Represents the natural logarithm's base (2.718).
Xi - Represents the explanatory variables
i- Represents a number of explanatory variables, where i = 1, 2, 3, n, and so forth and
𝑎 and βi- are estimated constants.
=wherezi=𝑎+
Zi=ln=𝑎+𝛽1AgeY+𝛽2GendY+𝛽3MSY+𝛽4FHEdu+𝛽5YEdu+𝛽6ACrt+𝛽7Attd+𝛽8WExpY+𝜀i
Where AGEY is the age of the youth, GENY represents the gender of the youth, MSY represents the Marital status of the youth, FHE is the family heads’ education, YEDU is the education of the youth, ACRT is access to credit services, ATTD is attitude toward the job and WEXY is work experience.
When the effects of other variables were controlled, the odds ratio was the measure of how the odds of unemployment changed per unit variation in the independent variables (Johnson & Wichern, 2007).
Goodness of fit
Pearson chi-square test
The observed (O) and expected (e) data served as the foundation for the Pearson x2 statistic.
Where:
Χ2 is the chi-square test statistic
O is the observed frequency
E is the expected frequency
When the effect of the other components is held constant, high Pearson chi-square values for a given independent variable show a strong correlation between each of the independent variables and the dependent variable.
Variable specification and hypothesis
The description of these explanatory variables, their measurement and expected sing of their relationship with the dependent variable was presented in the table below.
Table 5. Independent variables and expected sign.
Independent variables | Description of variables | Type | Measurement | Expected sign |
AGEY | Age of the youth | Continuous | Years | - |
GENY | Gender of the youth | Dummy | 1=male 2=female | +/- |
MSY | Marital status of youth | Dummy | 1=Married 0=Unmarried | +/- |
FHE | The highest level of education of the household heads | Continuous | 1= illiterate 2= primary education 3= secondary education 4= Higher education | - |
YEDU | Highest level of education for youth | Continuous | 1= illiterate 2= primary education 3= secondary education 4= Higher education | - |
ACRT | Access to credit | Dummy | 1 if there is access, 2 otherwise | - |
ATTD | Attitude towards own job | Dummy | 1 if positive attitude, 0 otherwise | - |
WEXY | Work experience | Continuous | Year of work experience | - |
Source: From own Expectation depending on literature reviewed
3. Result and Discussion
3.1. Introduction
This chapter, which is organized into three main sections, presents and discusses the findings of the analysis that was conducted to address the particular research objectives. The first section of this chapter includes the demographic and socioeconomic characteristics of the respondents; secondly respondents association and bi-variate analysis with unemployment status. Finally, malty variate analyses of the most important determinants of youth unemployment were presented.
The data were collected by distributing 366 questionnaires in five selected woreda and Kebeles of the Zone. A binary logistic regression model was utilized to identify the primary determinants of young unemployment, and the Pearson Chi-square statistics was employed to assess the relationship between the dependent and independent variables at a 95% confidence level.
The association between two variables was assessed by different methods. One technique for analyzing a bi-variate association is the Pearson X2 test. According to Montgomery and Peck (1992), it calculates the degree of correlation between a certain independent variable and the dependent variable while holding the other variables' influences constant. A test of association was conducted using the chi square test for all demographic and socioeconomic predictor factors, including sex, age, married status, youth and HHH education levels, work experience, credit accessibility, and attitude regarding one's own employment.
In the study, respondents were asked about their employment status before the survey date. According to
Figure 3; 249 (68%) of the 366 respondents were young people without jobs, whereas 117 (32%) were working at the time of the study.
Figure 3. Unemployment status of respondents.
3.2. Respondents’ Demographic Characteristics, Bi-Variatc Analysis and Their Association with Unemployment Status
Sex of Respondents
Table 6. Sex of Respondents and their Unemployment status.
Unemployment status | Sex |
Male | Female | |
Frequency | % | Frequency | % | Total |
Employment | 71 | 60.7 | 46 | 39 | 117 |
Unemployment | 129 | 51.8 | 120 | 48.2 | 249 |
Total | 200 | 54.6 | 166 | 45.4 | 366 |
P-value | | | | | 0.030 |
X2- test | | | | | 10.29 |
Source: Stata output-based Field Survey, 2024.
One of the demographic factors that were discovered to be connected to work status was the respondent's sex. As it was presented in
Table 5, 54.6% of respondents were male while the female respondents were 45.4%. The relationships between sex and youth unemployment status as
Table 5 shows the youth unemployment respondents, 51.8% were men and the remaining 48.2% were women. Sex and unemployment status are statistically significantly correlated, according to the chi-square test (P = 0.030).
Age of Respondents
Table 7. Age of Respondents and their Unemployment Status.
Unemployment status | Age group |
15-19 | 20-24 | 25-29 | Total |
Freq. | % | Freq. | % | Freq. | % | Total |
Employment | 10 | 9 | 43 | 37 | 64 | 55 | 117 |
Unemployment | 93 | 37 | 91 | 37 | 65 | 26 | 249 |
Total | 103 | 28 | 134 | 37 | 129 | 35 | 366 |
P-value | | | | | | | 0.059 |
X2- test | | | | | | | 36.51 |
Source: Stata output-based Field Survey, 2024.
Age is another demographic characteristic related to youth employment status. From the total of 366 youth, the age range from 15-19 constitutes 28% of respondents and Ages 20 to 24 accounted for the largest percentage of responders (37%) and the remaining age of respondents were constituted in the age range of 25-29 years were 35%. Among the respondents, percentage of unemployment is higher for age group 15-19 that is constitutes 90% and the lowest proportion of unemployment was observed for the age range of 25-29. In this regard, as shown in
Table 5 among the total of 249 unemployed youth, the age range from 15-19 and 20-24 constitute 37% were unemployed. The lowest proportion of unemployed youth was found in the age group 25-29 constituting 26%. This shows that as age increases almost there is no variation in unemployment status and also statistically the result illustrates the association between age and unemployment status was insignificant (p=0.059). The result contradicted with Amanuel (2016) that youths occupational status was significantly differs with age of the youth (p<0.05).
Respondents Marital Status
Table 8. Respondents Marital and their Unemployment Status.
Unemployment status | Marital status |
Single | Married | Divorced | Widowed | Total |
Frequency | % | Frequency | % | Frequency | % | Frequency | % |
Employment | 60 | 51 | 44 | 38 | 6 | 5 | 7 | 6 | 117 |
Unemployment | 192 | 77 | 48 | 19 | 4 | 2 | 5 | 2 | 249 |
Total youth | 252 | 69 | 92 | 25 | 10 | 3 | 12 | 3 | 366 |
P-value | | | | | | | | | 0.33 |
X2- test | | | | | | | | | 3.81 |
Source: Stata output-based Field Survey, 2024.
As indicated in
Table 7, 252 (69%) of the respondents were single, 25% were married and both divorced and widowed were 3% each. The relationship between marital status and youth unemployment status as indicated in the table 77% of the unemployed respondents were Single, 19% were married, divorced, and widowed were 2 and 2% respectively. The Chi-square test found that there is no statistically significance difference in terms of their unemployment status (p= 0.327). This finding confirms with that of (13).
3.3. Respondents Socio-Economic Characteristics, Bi-Variatc Analysis and their Association with Youth Unemployment
Work experience of Respondents
It is common knowledge that job experience is crucial to any activity. Therefore, the respondents were questioned if they had been involved in any productive activity prior to the survey date, and their work experience and young unemployment status were evaluated. According to the data, 72% of the respondents had no work experience, while 28% had either worked or had been involved in productive employment. This suggests that at the time of the study, the majority of respondents lacked work experience. According to the survey, 4% of young people without jobs said they had prior work experience, while 64% said they had none. The Chi-square test found that there is statistical significance in terms of their unemployment status (p= 0.000).
Table 9. Work experience of respondents and their unemployment status.
Unemployment status | Year of Work Experience of Respondents |
0 | 1 | 2 | 3 | 4 | 5 | 6 | 10 | Total | P-value | X2-test |
Employment | 29 | 12 | 30 | 25 | 14 | 3 | 3 | 1 | 117 | 0.0 | 160.3 |
Unemployment | 235 | 2 | 6 | 3 | 1 | 2 | 0 | 0 | 249 |
Total | In Number | 264 | 14 | 36 | 28 | 15 | 5 | 3 | 1 | 366 |
In % | 72 | 4 | 10 | 8 | 4 | 1 | 1 | 0 | 100 |
% of Unemployment | 89.0 | 14.3 | 16.7 | 10.7 | 6.7 | 40 | 0.0 | 0.0 | 68.0 |
Source: Stata output-based Field Survey, 2024.
Educational Level of Youths (Respondents)
Education plays an important role for employment, According to
Table 9 below, 2% of respondents had not attended any education, while 27%, 46% and 25% of youths completed Elementary education, Secondary education and Diploma & above respectively. According to
Table 8 below, which shows the relationship between youth unemployment and educational attainment, all young people without formal education were unemployed, whereas 73%, 71%, and 54% of those with elementary, secondary, and diploma degrees were unemployed, respectively. According to this research, people get jobs more often the more educated they are, and vice versa. To be more precise, the unemployment rate is medium for people with primary and secondary education levels and high for those who are illiterate. One fundamental explanation for this outcome could be because there are fewer graduates with higher education who can find work in offices with ease, and a large percentage of young people are only completing primary school. The results on the influence of education level have been verified by those of (31) in Tanzania, Isengard (2003) in Germany, Bruno and Cazes (1998) in France, and Akram (2020) in Jordan, all of whom showed that education level and skills were significant employment determinants.
Table 10. Youths and Youths’ household head Education level and their Unemployment status.
Unemployment status of youth | Education level Completed |
By | Illiterate | Elementary Education | Secondary Education | More than Diploma | Total | P-value | X2-test |
Employment | Youth | 0 | 26 | 48 | 43 | 117 | 0.001 | 9.65 |
Unemployment | 9 | 71 | 119 | 50 | 249 |
Total | In Number | 9 | 97 | 167 | 93 | 366 |
In % | 2 | 27 | 46 | 25 | 100 |
% of Unemployment | 100 | 73 | 71 | 54 | 62 |
Employment | Youths’ household head | 43 | 31 | 38 | 5 | 117 | 0.612 | 3.84 |
Unemployment | 48 | 120 | 65 | 16 | 249 |
Total | In Number | 91 | 151 | 103 | 21 | 366 |
In % | 25 | 41 | 28 | 6 | 100 |
% of Unemployment | 53 | 79 | 63 | 76 | 68 |
Source: Stata output-based Field Survey, 2024.
Educational Level of Youths’ households head
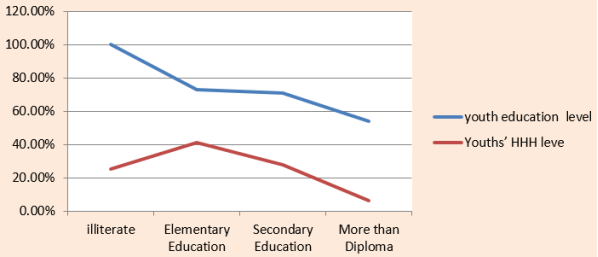
As shown in
Table 9 above, 25 % of respondents’ household heads had not attended education, while 41 %, 28% and 6% of youths’ household heads had completed Elementary education, Secondary education and Diploma & above respectively. 53% of youths or respondents whose their families were illiterate were unemployed while 73 %, 71% and 54% of youths whose families head completed Elementary education, Secondary education and Diploma & above respectively were unemployed. As shown in
figure 4 below the percentage of unemployment increases as the level of education of youth’s family heads increases from illiterate to elementary education. While it decreases as the level of education increases from Elementary education and above. This implies that the unemployment status of youth didn’t depend on the level of education of the family head since it fluctuates and the Pearson X
2 test also verified the correlation's was statistically insignificant (P=0.612). The study, however, contradicts to the conclusions of Adamu M. (2021), Shina (2020), and Wakene (2014), who found that father education level has a favorable and substantial impact at a 5% significance level.
Figure 4. Youths and Youths’ household head Education level and % of youth Unemployment.
Access to Credit service
Another socioeconomic feature of the respondents is their availability of financial services. As showed in
Table 10 from the collected data 37% of participants can access to credit services while 63% of them do not. 45% of those respondents with access to credit were unemployed while 80% of those who did not have credit accessibility were unemployed. This indicates the youth unemployment rate was higher for those respondents who did not have access to credit services. The relationship between youth unemployment status and access to credit service was found to be statistically significant (p=0.000). This result agreed with the findings of Amenu (2019) and opposed the findings of Aynalem Sh. and Mulugeta D. (2018).
Table 11. Attitude to Self unemployment and Credit Accessibility of Respondents.
| Attitude to Self unemployment | Credit accessibility |
Unemployment status | Negative | Positive | Total | Access | Not Access | Total |
Employed | 4 | 116 | 120 | 75 | 45 | 120 |
Unemployed | 42 | 204 | 246 | 62 | 184 | 246 |
Total | In number | 46 | 320 | 366 | 137 | 229 | 366 |
In % | 13 | 87 | 100 | 37 | 63 | 100 |
% of Unemployment | 91 | 64 | 67 | 45 | 80 | 67 |
P-value | 0.000 | 0.016 |
X2-test | 16.83 | 47.47 |
Source: Stata output-based Field Survey, 2024.
Attitudes to self-employment of participants
Data was also gathered regarding a respondent's attitude toward working for themselves in order to participate in the labor market. The information regarding the attitude to self-employment of respondents is shown in
Table 10 above, about 13% of the respondents have a negative attitude to self- employment and 87% have a positive outlook toward own job. 91% of youths who have negative attitudes to self-employment were unemployed while 67% of those who have positive attitude were unemployed. This shows that respondents who have a negative attitude to self-employment are more unemployed than those who have positive attitudes for they prefer jobs in private or government institutions in salary rather than they create their jobs. This finding demonstrates that in order to increase their income and level of freedom, both employed and young people without jobs preferred to launch their own businesses over working in paid positions (P=0.016).
3.4. Multivariate Analysis of Determinants of Youth Unemployment
In addition to Bi-Variate investigation, since the dependent variable is dam variable, a logistic regression model was used to examine the demographic and socioeconomic factors that contribute to youth unemployment. Binary logistic regression model was the multivariate statistical tool used to analyze the association between the dependent variable (youth unemployment status) and the predictor variables; namely sex, age, marital status, educational level of youth, educational level of HHH, work experience, attitude towards own job and credit accessibility.
The dependent variable's log odds (young unemployment vs. employment) are predicted by the logistic regression model.
log()=β0+β1X1+β2X2+β3X3+β4X4…………βkXk
Where p’ is the regression coefficient, along with its sign, indicates the magnitude and direction of the effect in the log odds being the category of concern of the response variable for a unit of increase in the predictor variable. The expression (Bi) is the predictable multiplicative change in the odds for a unit of increase in the predictors, controlling for the effects of others." is the predicted probability of the occasion unemployed coded with 1 and 0 otherwise" (Johnson and Wichern, 2007; Walker, 1996). A negative predictive coefficient (Bi<1) indicates that a group member's chances of being unemployed are higher than those of the reference category, while a positive predictive coefficient (Bi>1) indicates that the anticipated odds increase as the predictor value (X) increases. A decreased likelihood of unemployment for the reference group is indicated by an odd ratio of less than 1. Prior to utilizing the binary logistic regression model to assess the occasion's probability, the model's Multicollinearity was assessed.
Multicollinearity Effects
Multicollinearity in logistic regression is an outcome of strong inter-correlation between the predictor variables (Montgomery and Peckd 1992; Garson, 2009). The bivariate correlation analysis, as indicated in
table 11 below, revealed a weak correlation coefficient among the explanatory variables. Bivariate association is one of the methods used to identify inter-relationships among explanatory variables, and the existence of Multicollinearity is known based on the values of r. This was done in order to evaluate the Multicollinearity outcome in the model.
Table 12. Association Matrix.
| Unempl~s | AgeY | WExpY | GendY | MSY | YEdu | FHEdu | Attd | ACrt |
Unemp~s | 1.0000 | | | | | | | | |
AgeY | -0.3102 | 1.0000 | | | | | | | |
WExpY | 0.6171 | 0.3593 | 1.0000 | | | | | | |
GendY | - 0.1670 | 0.1276 | 0.0339 | 1.0000 | | | | | |
MSY | -0.1030 | 0.3713 | 0.1845 | -0.012 | 1.0000 | | | | |
YEdu | 0.1598 | -0.115 | -0.0241 | -0.088 | 0.0668 | 1.0000 | | | |
FHEdu | 0.1028 | -0.088 | -0.1233 | -0.057 | 0.0183 | -0.1036 | 1.0000 | | |
Attd | -0.1946 | 0.0385 | 0.1002 | 0.1855 | -0.017 | -0.1127 | -0.0707 | 1.0000 | |
ACrt | 0.3618 | -0.096 | -0.329 | -0.110 | -0.082 | -0.031 | 0.0778 | -0.123 | 1.000 |
Source: Stata output-based Field Survey, 2024.
Table 13. The outcome of binary logistic regression.
Unemployment status | Exp(B) (OR) | S.E. | Wald (Z) | Sig. (p-value) | 95% C.I. for EXP(B) |
Lower | Upper |
AgeY | .9145086 | .0433484 | 3.55 | 0.059 | .8333745 | 1.003542 |
GendY | .4837812 | .1622002 | 4.69 | 0.030 | .250762 | .9333325 |
MSY | 1.200994 | .2246278 | 0.96 | 0.327 | .8324087 | 1.732788 |
FHEdu | 1.087161 | .1791044 | 0.26 | 0.51 | .7871595 | 1.501499 |
YEdu | 1.687947 | .2754956 | 10.29 | 0.001 | 1.225833 | 2.324269 |
ACrt | 3.191785 | 1.039469 | 12.70 | 0.000 | 1.685865 | 6.04289 |
Attd | .1360151 | .112372 | 5.83 | 0.016 | .0269369 | .686794 |
WExpY | .2466884 | .0455642 | 57.42 | 0.000 | .1717628 | .3542978 |
Const. | 338.7233 | 158.3596 | | 0.018 | 2.393128 | 10479.07 |
Source: Stata output-based Field Survey, 2024.
Sex (GendY)
Youth employment status was highly correlated with sex. According to the results of the regression analysis, men had a 0.48 (OR) lower relative risk of unemployment than women (
Table 11). The regression coefficient and multivariate analysis between young unemployment and sex were significant at p =0.03. This was consistent with the prior expectation. This study was also consistent with ILO (2004) in South Africa, Hallerod and Westberg (2006), Amanuel D., (2016), Asalfew (2011), Qayyum (2007) and contradicted Malede (2017), Deribe Assefa (2015) and Amenu (2019) in which the risk of unemployment was higher for males.
Furthermore, the information gathered from the interview supported the conclusions drawn from the survey data. Women in the Kellem Wollega Zone have lower employment rates than men due to a variety of factors, including a lower level of education than men, greater responsibility for household duties, how women consider themselves, and other factors. As a result, young women in the Kellem Wollega Zone are more likely than men to be unemployed.
Work experience (WExpY)
Work experience is expected to influence the unemployment status of youth in the study area. The result showed that Work experience had a significant effect on youth unemployment in the Kellem Wollega Zone. Those without work experience continue to be unemployed at a higher rate than those with work experience. This study demonstrates that people without work experience would be more likely encountered by unemployment. The likelihood of unemployment was 0.25 times lower for those with work experience than for those without any work experience. Young people's work experience and unemployment status had a significant regression coefficient (P=0.000). Thus, the likelihood of becoming unemployed is increased by a lack of work experience. According to Shita and Dereje (2018) and Adamu M. (2021), work experience has a negative impact on unemployment at a significance level of 1%. These findings are in line with their findings.
Education Level of Youth (YEdu)
The youth education levels were statistically significant at the 0.05 level, as shown in
Table 12. This demonstrates that a youth educational attainment has a big impact on predicting their likelihood of unemployment. The findings show that the youth education level is statistically significant (p = 0.001) and has a negative coefficient. This outcome was consistent with the earlier prediction and shows that a low level of education contributed to the high rate of youth unemployment in the Kellem Wollega Zone. Compared to educated youth, the sample probabilities of unemployment for illiterate young were 1.7 times higher.
This demonstrated that a respondent's educational attainment had a substantial and favorable impact on their work position. This result is in line with research by (47) and (51) which suggest that increasing educational attainment will lower the likelihood of unemployment. Higher education was linked to a higher chance of getting work, according to Berhe's (2021) findings. Compared to those who are illiterate and just have a primary education, those who pursue secondary education, certificates, or higher education are less likely to be unemployed.
In support of this assertion, interviewees also mentioned the following: Youths with only an elementary education and those who are illiterate currently have higher unemployment rates. While some of them finished eighth grade, others were illiterate, and none of them were able to find work in any of the other socioeconomic categories. They lack the information, abilities, and skills needed in the market at this educational level. They lost their productive time and did not enter the labor market due to their poor level of human capital.
Therefore, it was proven that unemployment and youth education level are negatively correlated, meaning that young people with lower levels of education had lower employment rates than those with higher levels of education.
Access to credit (ACrt)
It is understood that individuals who have improved access to credit may contribute in minor businesses. The relationship between youth unemployment status and access to credit service was found to be statistically significant (p=0.000) at a 5% significance level. Respondents without any credit access had a 3.2 (OR) higher chance of being unemployed than those with credit access. This suggests that young people without access to startup financing are never launching their own small businesses, which makes them more vulnerable to unemployment. This outcome was in line with (13).
Accordingly, all of the interviewed participants noted that: Initial capital to start a business is a severe problem of youth unemployment due to lack of collateral to get credit, bureaucracy to get credit and the requirement of saving which accounts for such factors, accessing credit services difficult. Thus, the risks of unemployment are higher for youth who have no credit access than others who have access to the service.
Attitude towards own job (Attd)
Attitude towards own job has a significant effect on the likelihood of youth employment status. Individuals who have a negative attitude toward their own job remain unemployed than those who have a positive attitude. This study demonstrates that respondents who have a poor attitude toward their own work are more likely to experience unemployment. The likelihood of being unemployed for those individuals who positive attitude towards own job was 0.14 times lower as compared to those who have negative attitude in any available job in the labor market. The relationship was statistically significant (P= 0.016). However, according to Mengistu B (2023) the relationship between Interest to join a job and Youth employment status is not statistically significant.
Confirming this, interviewed respondents remarked that, having a positive attitude towards their own job is the unique characteristics of youth. Most of them, here, prefer to work and want to start their own business to generate better income and for their freedom. Also, most of them didn’t join higher education; due to this, the only option they have is to start their own business opportunity in their surroundings.
4. Conclusions and Recommendations
This section of the thesis contains the summary, conclusions and recommendations regarding the study area. It reviews and concludes the spirit of the whole research and draws some recommendations for local concerns.
In this research, an attempt was undertaken to identify the demographic and socioeconomic determinants of youth unemployment in Kellem Wollega Zone, Oromia Regional State. The survey was intentionally cross-sectional, and it made extensive use of primary data gathered by collecting cross-sectional data to identify the factor that determines youth unemployment. Information about the social and demographic characteristics of young people was gathered from 366 youths. Descriptive statistics and a binary logistic regression model were used to evaluate the data after the participant populations were properly selected using a multistage sampling technique.
Bi-variate analysis was used to examine the youth unemployment rate in association to demographic and socioeconomic factors. Regarding gender, women faced challenges in their employment prospects. The percentage of unemployed women was higher than that of men. Concerning the work experience of participant, experienced youths were more employed as compared to non-experienced youth.
Regarding the educational attainment of the youth, those who were illiterate did not have jobs. On the other hand, people with only a primary or secondary education were less likely to be employed than people with more than a diploma in the positions that were available in the study area's labor market. Respondents who had access to credit services were employed than others who had no access to the service. Concerning attitude to own job the unemployment rate is high for those who have a negative attitude towards their own job to engage in self-employment.
Among the demographic variables, the multivariate analysis shows that the sex of respondents was significantly related to youth unemployment, while marital status and age were insignificant at a 5% level of confidence. It became clear that women had a larger relative risk of unemployment than men. Considering the socioeconomic factors that were included in the model job experience, educational level of youths, credit access and attitude towards their own jobs have been shown to have a substantial correlation with young unemployment.
There was a significant relative likelihood of unemployment for those respondents who were illiterate and had a primary level of education; youth who had no credit access; respondents who had no work experience and participants who had a negative attitude towards their own jobs. Respondents' household head education level was determined to be negligible at a 5% level of confidence and was correlated with youth unemployment in the research area. Generally speaking, the majority of the predictor factors that were part of the regression analysis demonstrated a significant influence on young unemployment in the anticipated direction, and this is supported by the majority of research studies.
4.1. Conclusions
Based on the findings of this study, the researcher derived the following conclusions in order to answer the research question that this study required to address. From demographic variables sex was highly correlated with young unemployment people. Additionally, based on the socioeconomic factors that the model incorporates, work experience, educational level of youth, credit access, attitude towards own job have been shown to have a substantial correlation with young unemployment. However, the youth unemployment status was not significantly correlated with the youths' age, marital status, or HHH level of education.
Lastly, the youth responded to the major determinants of unemployment and the solution to reduce the problem of youth include, gender-based discrimination, skills mismatch and experience, inadequate credit availability, and attitude towards own job were constituted to the cause. Then the concerned bodies should work to a maximum effort to reduce their challenge. The supports needed include government incentives to encourage entrepreneurship, access to credit facilities/financial assistance, and facilitating for the youths to get work experience and more training.
In general, young people's work opportunities are determined by socioeconomic and demographic factors. Therefore, the social and economic costs of youth unemployment are likely to fall on young people, families, the government, societies, and the nation as a whole.
4.2. Recommendations
Depending on the findings and conclusions of the study, the following recommendations are made:- Regulations that allow young people to gain more training and work experience should be provided by the government bodies TVET institutions/colleges should deliver both technical and business training to youth job hunters and improve entrepreneurial spirit, continuous training and experience sharing.
The government ought to provide female youth special consideration by giving them access to various employment options or other resources. It has been shown that encouraging young people to raise their educational attainment and level is strongly associated with a decreased likelihood of unemployment. This illustrates the importance of motivating young people to advance or pursue further education. Young people with prior work experience had a lower unemployment rate. So providing both technical and business training and improving their entrepreneurial spirit young unemployment, by continuous training and experience sharing is important.
Improve problems of access to credit (especially on the way they acquire credit) and bring other job opportunity options to reduce youth unemployment and develop youth attitudes or bring behavioral changes. Microfinance institutes should change the practice of the loaning systems and should also reduce the interest rates for young unemployed and strengthen their entrepreneurial spirit. Initial capital to start a business is a severe problem of youth unemployment due to non-Interest credit forbidden by the Muslim religion, so the support should be made by the government to deliver interest-free credit to youth and minimize barriers (bureaucracies) to access credit.
By increasing self-reliance through self-employment, entrepreneurship can help governments to reduce poverty and improve unemployment rates. A stable and healthy entrepreneurial environment has been facilitated by government policies and initiatives like low taxation, enabling incentives, training, and education, as well as the provision of financial services. In addition to the government creating favorable conditions, young people also generate their own jobs.
4.3. Further Research Direction
Because of the inadequate resources, this study was only applied to the Kellem Wollega Zone, but a valuable result may come up by taking data from different areas. Moreover, in this study, some findings concerning some determinants are different from earlier studies. This requires further research in order to further identify and examine the determinants of youth unemployment.
Abbreviations
ACrt | Access to Credit |
ADLI | Agriculture Development Led to Industrialization |
AgeY | Age of Youth |
ARDL | Auto Regressive Distributed Lag Model |
Attd | Attitude Towards Job |
CSA | Central Statistics Agency |
EDC | Entrepreneurship Development Center |
FHEdu | Family Heads’ Highest Education Level |
GDP | Growth Domestic Product |
GendY | Gender of Youth |
GMM | Generalized Method of Moments |
IJED | International Journal of Economic Development |
IJFAM | International Journal of Financial, Accounting, and Management |
ILO | International Labor Organization |
LFS | Labor Force Survey |
JLMPS | Jordan Labor Market Panel Survey |
MOYSC | Ministry of Youth, Sports and Culture |
MSY | Marital Status of Youth |
OECD | Organization for Economic Cooperation and Development |
USD | United States Dollar |
WB | World Bank |
WExpY | Work Experience of Youth |
YEdu | Youth Highest Education Level |
Conflicts of Interest
There is no conflict of interest.
Appendix
Dambi Dollo University
Department of Economics
This questionnaire is prepared to collect data for the research on the title “DETERMINANTS OF YOUTH UNEMPLOYMENT IN KELLEM WOLLEGA ZONE’’ for the fulfillment of an MSc degree in development economics. Hence, the Information you will provide is very important for the success of the research. Moreover, the data will be used only for academic study purposes only.
General Instruction
Please try to answer all questions.
Do not write your name.
Put<< x>> in the appropriate box you select.
More than one answer is possible.
For open-ended questions use the blank space provided.
1. Address: Woreda _______________ Kebele _____________
2. Gender (sex): Male

Female

3. Age: _____________________
4. Educational status of youth: primary school

Secondary school

College

and above None

5. Marital Status of youth:
Married

Unmarried

Divorced Widowed

6. A Family heads’ Educational status Primary school

Secondary School

College

and above None

7. How many years of work experience do you have?_______________________
8. Have you been in a steady job for the past six months Yes

No

9. Are you actively seeking work for last six months Yes

No

10. If your answer is “No” why?
Not interested

No vacancy Criteria Experience

Others if any _____________________
11. What is your attitude toward self-employment? Not good

Good

Very good

12. If your answer to question 10 is good, what would be your constraints to start?
Lack of initial budget

Lack of suitable place

No suitable business

Other if any________________________________
13. If your answer to question 10 is Not good,
What would be your possible reasons? ___________________________
14. Is there any credit facility in the town? Yes

No

15. Where would you like to spend most of your time being unemployed youth?
Hotel

Vacancy post

Sport area

Film house

others if any_______________________________________
16. What would you suggest as the probable consequence of being unemployed
Physiological problem

Social isolation

Family dependency

Political constraint Health problem

Other if any_____________________________________
17. Who do you think to curb the major youth challenges of unemployment in the study area?
Government

CSOs

and NGOs

Youth themselves

Parents

If others please specify ---------------------------------------------------------
References
| [1] |
Abebe, F. K. (2012), Unemployment in Urban Ethiopia: Determinants and Impact on Household Welfare Ethiopian Journal of Economics, Vol Xxi No. 2.
|
| [2] |
ABERA. (2011). Demographic and Socio-Economic Determinants of Youth Unemployment in Debere Birhan Town.
|
| [3] |
Abiy. (2020). Unemployment and Economic Growth in Ethiopia, Developing Country Studies, IISTE March.
|
| [4] |
Abugamea. (2018). Determinants of Unemployment: Empirical Evidence from Palestine. Munich: Personal RePEc Archive.
|
| [5] |
Adeto. (2019). Preventing violent extremism in the Horn: The case of ethnic extremism in Ethiopia Policy paper. Ethiopia: European Institute of Peace.
|
| [6] |
Alemnew. (2014). cited in Aynalem Sh. and Mulugeta D. (2018), Determinants of Urban Youth Unemployment; Evidence from East Gojjam Zone, Ethiopia; International Journal of Economic Development (IJED).
|
| [7] |
Abshoko, A. D. (2016). Determinants of youth unemployment evidence from Ethiopia. Global Journal of Human-Social Science: Arts & Humanities - Psychology, 16(4), Version 1.0 Year 2016.
|
| [8] |
Binyam, A. (2015). Unemployment Problems in Rban Ethiopia; Mikeleaks Blogspot.
|
| [9] |
Berhanu, D. (2007). Abraham Tekeste and Hannah van der Deijl; I: emp/pol/ch/Ethiopia (14.11.05).
|
| [10] |
Central Statistical Agent. (2007). Population and housing census report. Addis Ababa, Ethiopia.
|
| [11] |
Central Statistical Agent. (2000). (CSA). Population project of Oromia region, Ethiopia national labor survey edition.
|
| [12] |
Central Statistical Agent. (2010). Report on Labor Force Survey 1999. Addis Ababa, Ethiopia: Statistical Bulletin.
|
| [13] |
Dejene, T. (2016). Determinants of youth unemployment in Ambo city: Global Journal of management and business Guresearch.
|
| [14] |
Dejene et al. (2016). Assess the determinants of youth unemployment at Ambo, Ethiopia. International Journal of Economics and Business Management, 2(2).
|
| [15] |
Dander, S. (2006). Unemployment duration in developing economies: Evidence from urban Ethiopia. Journal of Developing Area, 64.
|
| [16] |
Efa.(2020). Urban Unemployment Patterns: Challenges, Coping Mechanisms and Self Employment Trends. Samara: International Journal of Science and Research (IJSR).
|
| [17] |
Essay. (2020). Determinants of Youth Unemployment: The Case of Hawassa. Hawassa: IOSR Journal of Business and Management (IOSR-JBM).
|
| [18] |
Fatih, A. (2018). Youth Unemployment as A Growing Global Threat.
|
| [19] |
Gizachew, G. (2017). Determinants of Women Unemployment: Evidence from Ethiopia (Case of HalabaTown, SNNPR); International Journal of Development Research, 7, (11).
|
| [20] |
Hafiz, H. (2020). Determinants of Youth Unemployment: The Case. Jimma:
repository.ju.edu.et
|
| [21] |
Higgins. (2001). Youth Unemployment and Employment Policy: A Global Perspective Economics, Political Science. Economics, Political Science, Sociology.
|
| [22] |
International Labor Organization (ILO). (1986). World employment and unemployment. Genva: James Tobin full employment and growth, UK.
|
| [23] |
ILO. (2009a). Global Employment Trends ILO, Geneva.
|
| [24] |
Kirshna, P. (1996). Family background education and employment background, education and employment in urban Ethiopia. Oxford bulletin of economics and statics, 58(1). 167-182.
|
| [25] |
Kothari. (2004). Research Methodology New Age International India; Publishers Jaipur.
|
| [26] |
Leary. (2004). The essential guide to doing research British; SAGE Publications Lt.
|
| [27] |
Maddala. (2013). Limited Dependent and Qualitative Variables in Econometrics. Published online by Cambridge University Press.
|
| [28] |
Mankiw. N. G. (2000). Macroeconomics, 5th edition. New York, NY: Worth.
|
| [29] |
Meseret. (2020). Determinants of Youth Unemployment in Urban Ethiopia.
|
| [30] |
Mohammed. (2020). Rural-Urban Migration and the Expansion of Youths’ Begging in Jigjig Town, East Ethiopia. International Journal of Contemporary Economics and Administrative Science.
|
| [31] |
Msigwa and Kipesha. (2013). Determinants of Youth Unemployment in Developing Countries, Tanzania; Journal of Economics and Sustainable Development.
|
| [32] |
Maudlin, M. (2016). Determinants of Youth Unemployment in Urban Areas of Ethiopia, International Journal of Scientific and Research Publications, Volume 6, Issue 5, May 2016.
|
| [33] |
Niall O’Higgins. (2001). Youth unemployment and employment policy; a global perspective; Geneva.
|
| [34] |
O’Higgins. (1997, 2003). The challenge of youth unemployment; International Social Security Review.
|
| [35] |
OECD. (2020). Unemployment Rates Report News Release: March 2020.
|
| [36] |
Paul. (1977). The economic development of 3rd world.
|
| [37] |
Philipdegwa and Jhon, P. P. (1973). Employment in Africa; some critical issues, ILO, Geneva.
|
| [38] |
Schervish. (1983). Structural Determinants of Unemployment: Vulnerability and Power in Market Relations; Academic Press.
|
| [39] |
Shita and Dereje. (2018). Determinants of Urban Youth Unemployment; Evidence from East Gojjam Zone, Ethiopia. International Journal of Economic Development Volume 11.
|
| [40] |
Siddiqa. (2021). Determinants of Unemployment in Selected Developing Countries: A Panel Data Analysis; Journal of Economic Impact 3(1): 19-26.
|
| [41] |
Smaith. (1997). Modern labor economics, theory and public policy. 6th edition USA.
|
| [42] |
Smaith. (2000). Handbook of Research Methods in Social and Personality Psychology, Cambridge University Press, New York.
|
| [43] |
Teklu. (2016). Theories of Unemployment and its application in Ethiopia: A Review; (IJRDO –Journal of Agriculture and research).
|
| [44] |
Todaro. (1994). Development economics, New York University and population country.
|
| [45] |
Aynalem Sh. and Mulugeta D. (2018), Determinants of Urban Youth Unemployment; Evidence from East Gojjam Zone, Ethiopia; International Journal of Economic Development (IJED).
|
| [46] |
CSA. (2014).Statistical report on the 2014 urban employment unemployment survey.
|
| [47] |
Duguma, A.L. and Tolcha, F.T.,(2019). Determinants of Urban Youth Unemployment: The Case of Guder Town, Western Shoa Zone, Ethiopia.
|
| [48] |
CSA. (2018). “Statistical Report on the 2018 Urban Employment and Unemployment Survey, Bulletin no. 586, October, 2018” and at CSA website: www. csa.gov.et.
|
| [49] |
Amanuel, D., (2016). Determinants Of Youth Unemployment; Evidence From Ethiopia. Global Journal of Human-Social Science: A Arts and HumanitiesPsychology, 16.
|
| [50] |
EDC Ethiopia website:
https://www.edcethiopia.org/
2021
|
| [51] |
Kemal, A., (2020). Determinants of urban youth unemployment: the case of Adama city, East Shoa, Oromia National Regional State
|
Cite This Article
-
APA Style
Gelalcha, W. G., Wakjira, M. (2025). Determinants of Youth Unemployment in the Case of Kellem Wollega Zone, Oromia Regional State, Ethiopia. Journal of Business and Economic Development, 10(2), 94-113. https://doi.org/10.11648/j.jbed.20251002.15
 Copy
|
Copy
|
 Download
ACS Style
Gelalcha, W. G.; Wakjira, M. Determinants of Youth Unemployment in the Case of Kellem Wollega Zone, Oromia Regional State, Ethiopia. J. Bus. Econ. Dev. 2025, 10(2), 94-113. doi: 10.11648/j.jbed.20251002.15
Copy
|
Download
AMA Style
Gelalcha WG, Wakjira M. Determinants of Youth Unemployment in the Case of Kellem Wollega Zone, Oromia Regional State, Ethiopia. J Bus Econ Dev. 2025;10(2):94-113. doi: 10.11648/j.jbed.20251002.15
Copy
|
Download
-
@article{10.11648/j.jbed.20251002.15,
  author = {Workneh Girma Gelalcha and Meseret Wakjira},
  title = {Determinants of Youth Unemployment in the Case of Kellem Wollega Zone, Oromia Regional State, Ethiopia
},
  journal = {Journal of Business and Economic Development},
  volume = {10},
  number = {2},
  pages = {94-113},
  doi = {10.11648/j.jbed.20251002.15},
  url = {https://doi.org/10.11648/j.jbed.20251002.15},
  eprint = {https://article.sciencepublishinggroup.com/pdf/10.11648.j.jbed.20251002.15},
  abstract = {Unemployment is a macroeconomic problem that disturbs people most directly and strictly. The younger generation is exposed more by unemployment compared to adults due to different aspects. This study designed to identify the major determinants of youth unemployment in Kellem Wollega Zone. The research has employed descriptive and explanatory research design in this study, a combination of qualitative and quantitative approaches were employed. The data was collected by designating questionnaires to an overall number 366 youth by means of multi stage sampling technique in five selected kebeles. Descriptive and logistic regression model were used to analyze the collected data. The result from the study indicated that approximately one third of the respondents were employed, whereas the remaining two third was unemployed. The result of binary logistic regression analysis indicated that Sex, work experience, educational level of youth, Access to credit and attitude to words own Job had significant effect on youth unemployment in Kellem Wollega Zone. However, the variables Age, Marital status of youth and educational level of house hold head was found to be statistically insignificant. It is recommended that, motivating young people to improve their educational attainment, empower women, and participate more in social, economic and political aspects; encourage youth to increase their credit service and accessibility, and improve youth attitudes towards self-employment by providing them entrepreneur training were suggested as recommendations.
},
 year = {2025}
}
Copy
|
Download
-
TY  - JOUR
T1  - Determinants of Youth Unemployment in the Case of Kellem Wollega Zone, Oromia Regional State, Ethiopia

AU  - Workneh Girma Gelalcha
AU  - Meseret Wakjira
Y1  - 2025/06/18
PY  - 2025
N1  - https://doi.org/10.11648/j.jbed.20251002.15
DO  - 10.11648/j.jbed.20251002.15
T2  - Journal of Business and Economic Development
JF  - Journal of Business and Economic Development
JO  - Journal of Business and Economic Development
SP  - 94
EP  - 113
PB  - Science Publishing Group
SN  - 2637-3874
UR  - https://doi.org/10.11648/j.jbed.20251002.15
AB  - Unemployment is a macroeconomic problem that disturbs people most directly and strictly. The younger generation is exposed more by unemployment compared to adults due to different aspects. This study designed to identify the major determinants of youth unemployment in Kellem Wollega Zone. The research has employed descriptive and explanatory research design in this study, a combination of qualitative and quantitative approaches were employed. The data was collected by designating questionnaires to an overall number 366 youth by means of multi stage sampling technique in five selected kebeles. Descriptive and logistic regression model were used to analyze the collected data. The result from the study indicated that approximately one third of the respondents were employed, whereas the remaining two third was unemployed. The result of binary logistic regression analysis indicated that Sex, work experience, educational level of youth, Access to credit and attitude to words own Job had significant effect on youth unemployment in Kellem Wollega Zone. However, the variables Age, Marital status of youth and educational level of house hold head was found to be statistically insignificant. It is recommended that, motivating young people to improve their educational attainment, empower women, and participate more in social, economic and political aspects; encourage youth to increase their credit service and accessibility, and improve youth attitudes towards self-employment by providing them entrepreneur training were suggested as recommendations.

VL  - 10
IS  - 2
ER  -
Copy
|
Download